Jake Pusateri


In my day job, one of the things I’m working on is a continuous delivery system named “Bertha”. Bertha is built on a Postgres database, with an API server that exposes a GraphQL endpoint, and a React frontend using Apollo.
This has been working great. Exposing the API in GraphQL allows the frontend to easily construct any views of the data, and only request the data that it needs for that view. The backend can then efficiently query the database with dataloader.
Last week, I noticed the frontend was responding really slowly. Queries were taking 5 or more seconds to the backend and timing out. This made the UI nearly unusable, so I took a look at what was going on.
My first stop was the host metrics:
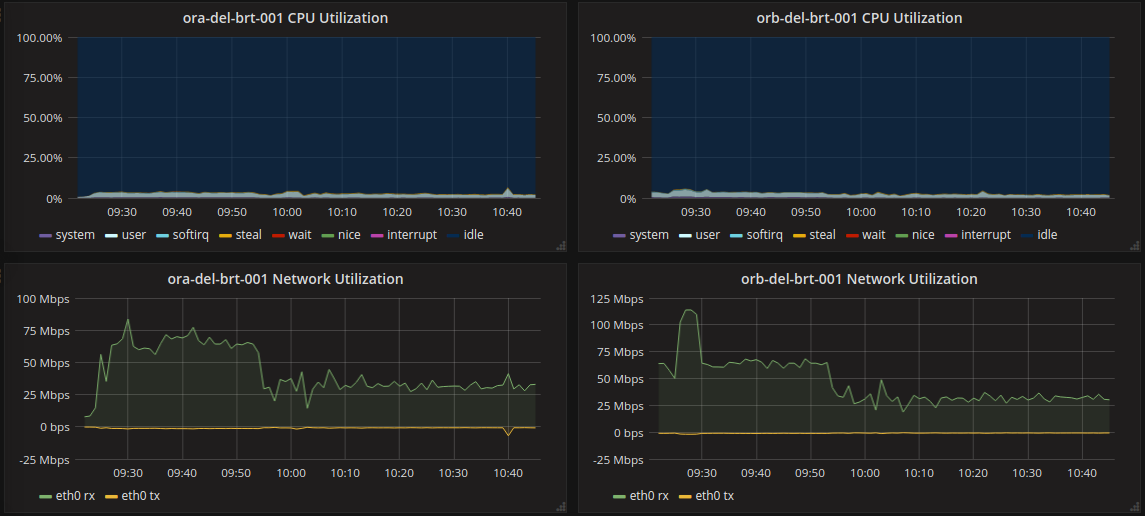
Nothing from those metrics immediately jumped out at me as suspicious. CPU looked good and nothing was maxed or spiking so I moved on to the database. The instance is pretty small, maybe it was being overworked? Unfortunately for my investigation, the database metrics also looked similarly good, so I go went to the host metrics. After some thought, the network traffic started to look suspicious. Considering most of the work this server does is query the database and format the results back to the frontend, the rx (bytes received) should roughly match the tx (bytes sent). In the above graph, each host is receiving 30 mbps and sending only 0.7 mbps. Clearly we’re requesting something from the database that’s just getting thrown away before it gets sent to the frontend.
The most common screen in the app is this one:
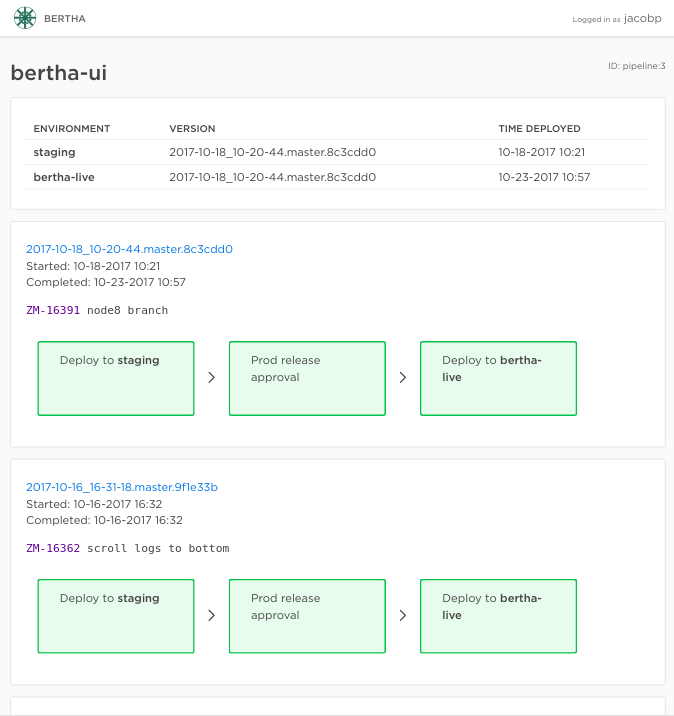
To display that page, the frontend asks for all the pipeline instances and steps inside of them with something like the following graphql query:
pipeline(id: 1) {
    pipeline_instances {
        version
        pipeline_steps {
            Type
            name
            inProgress
            error
            completed
        }
    }
}
This query is run every 3 seconds per open browser tab, so updates can be shown to the user. When you click on an individual step, it is expanded and starts polling another query with additional details.
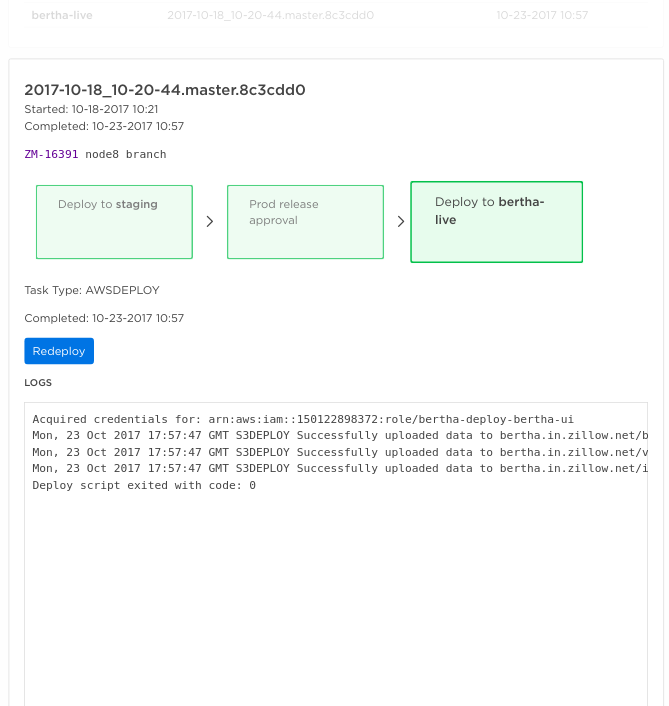
The most relevant addition here is logs:
pipeline_step(id: 1) {
    type
    name
    inProgress
    error
    completed
    logs
}
This is GraphQL working exactly by design. The frontend requests only the fields it needs when it needs them.
While thinking about what data the backend throws away from the database, I remembered that the backend didn’t work the same way the frontend did when talking to the database. Each time any item was requested, the app would SELECT * from the database and get all the fields. In the case of pipeline steps, this included logs, and these logs can often be very large. Considering the main query would load every log of every step in every pipeline instance requested, I had a feeling that these logs represented that data that was being thrown away. Whether or not this was the performance problem, I didn’t know but it couldn’t hurt to fix.
To implement this fix, first I changed the default load of a pipeline step to not include the logs. This data was unused in the backend, so safe to remove from the default object. This meant changing SELECT * to replace the * with a list of all fields on the object except for logs field. Next, I had to add the logs back in for graphql queries that requested them. I added a separate dataloader that would just select the logs field. While this would result in an extra database query for the clients that do ask for logs, they are in the minority and the call is very quick when asking for a single row by primary key ID. This change was transparent to the client and totally backwards-compatible. I don’t think this would’ve have been possible nearly as easily without something like graphql. It would have required two new endpoints or additional parameterization of an existing endpoint as well as client code changes.
Results
Once this new code got deployed the results were instant and dramatic.
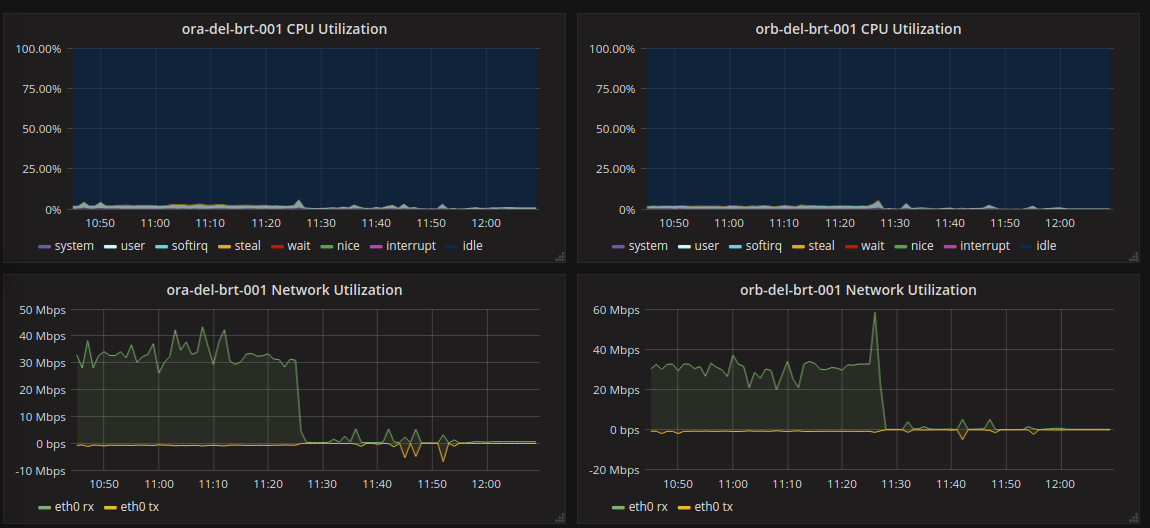
The rx falls off a cliff right away. The same queries that were taking 5+ seconds are now completing in 50ms, and the performance problem was solved. It seems then that the bottleneck was the transfer of the query results from the database to the API server. This suggests that db.t2.micro instance type, which has the unspecific network performance of “Low” actually provides about 70mbps of capacity. This is consistent with what I’ve seen elsewhere in AWS. If I hadn’t been able to reduce bandwidth, I may have had to upgrade instance type simply for better network. As is, the flexilibility and declarativeness of GraphQL let a performance issue be resolved easily.
More from me
To get notified as soon as new posts go up, sign up for my email list.